PUE/DCIE Monitoring Tool - EDSA's Paladin System

EDSA announces a PUE/DCIE monitoring tool.

EDSA Introduces PUE-DCiE Advisor
for Increasing Data Center Energy Efficiency

EDSA’s Paladin® Live™ is one of thefirst power analytics software program to automatically calculate and present power efficiency ratings, using standards published by The Green Grid

SAN DIEGO, Calif. – August 21, 2008 – EDSA Corp., developers of the Paladin® platform of power analytics™ software, today announced the release of its Paladin® Live PUE-DCiE Advisor™ in support of the new electrical power efficiency standards developed by the global IT association, The Green Grid. The Green Grid is a collaborative organization of approximately 200 leading technology organizations, led by such firms as AT&T, Cisco, Dell, Hewlett-Packard, IBM, Intel, Microsoft, and others for which whom mission-critical computing and environmental responsibility are driving corporate priorities.

image

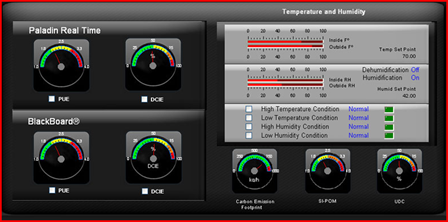
To embrace the organization’s standards, EDSA’s Paladin Live power systems diagnostics platform has been enhanced to automatically present users with The Green Grid’s Power Usage Effectiveness (PUE) and data center infrastructure efficiency (DCiE) ratings in real-time. Used in conjunction with Paladin Live’s new Paladin® BlackBoard™ option, users gain the valuable ability to take a baseline model of their operations, and – in real time – allow them to make changes or propose “what if” scenarios, allowing them to project the future impact of those changes on the calculation of PUE or DCiE.

This looks nice on the surface.  i would be more interested in a diagram that shows all their monitoring points that support their PUE/DCiE calculations.

The Paladin Live PUE-DCiE Advisor feature attacks the problem of energy inefficiency in two ways: first, the Company’s Paladin® DesignBase™ computer-aided design (CAD) modeler allows power systems engineers to design, simulate, and analyze the power systems model to optimize energy usage prior to construction. Once the facility is operational, EDSA’s Paladin® Live™ platform continually diagnoses the facility’s performance by benchmarking it back against the design model. This continual comparison of design specifications with actual operating parameters helps to ensure that anomalies are quickly identified, isolated, and resolved.

By presenting its findings in PUE and DCiE format, Paladin Live helps data center operators, for the first time, to make informed, real-time decisions about the energy efficiency of their facilities, and develop actionable strategies for ensuring that their operations are as failsafe and energy efficient as possible.

As most of you know how you collect the numbers is critical to getting a good PUE calculation.

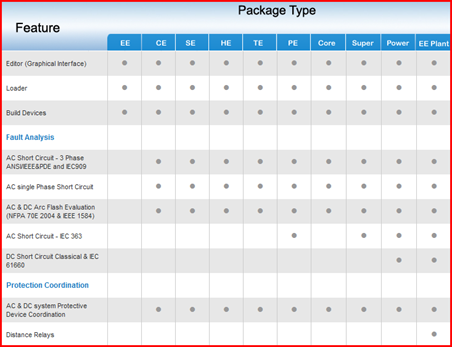
Digging a little further I found their Power DesignBase product on this page. Here is feature matrix of their different versions.

image

Read more

Home Energy Monitoring Solutions, GreenBox gets Pilot Deal with Oklahoma Utility

GigaOm has a post about GreenBox’s Home Energy Monitoring Solution scoring a pilot with Oklahoma Gas and Electric.

Flash Creator Goes Green With New Startup, Greenbox
Katie Fehrenbacher, Thursday, August 21, 2008 at 4:06 PM PT Comments (0)

Greenbox, a startup founded by the creators of Flash, is trying to recreate the success of their online ecosystem for graphics and media — but this time for the power that flows into your home. This week, after Flash-founders Jonathan Gay and Robert Tatsumi have spent more than a year working on their software for home energy management, Greenbox says it has scored a pilot deal with Oklahoma Gas and Electric to test its software with a portion of the utility’s customers using smart meters.

For a startup like Greenbox, which is backed by the former CEO and CFO of Macromedia and aims to help residents cut back on energy use, utilities are the initial gatekeepers, so partnerships with the power providers is crucial. It’s a little like a mobile startup finally getting placement on a carrier’s site or having an app shipped on a handset. For Greenbox, the deal represents its first access to customers who can give feedback on the startup’s user interface — does it provide enough insight into power rates, does it affect behavior, how easy is it to navigate?

Greenbox VP of Marketing Matt Smith gave us a demo of the software this week, and from the looks of it, the interface is on its way, though still in the early stages. The premise is to help the customer understand electricity costs, and in that way it reminded me of financial startup Mint — it provides insight into an environment where customers have traditionally had very little transparency. And compared to competitors making similar software, the company is focusing on “actionable items” to develop an “ecosystem, not just software,” explains Smith. That could deliver value for developers, utilities, demand-response companies, smart-grid firms, smart-home hardware makers, and finally the power user.

GreenBox uses Zigbee for wireless devices. Their technical partners are

  • ZigBee Alliance
  • Ember Corporation
  • Daintree Networks, Inc.
  • The strength of GreenBox is the user interface/experience focus given the Adobe and Macromedia executives. In my prior life I used to work with both companies and they both have design and user interface in their DNA. But, they have fallen in the trap I see many energy monitoring solutions going for home consumers, and not the commercial market. Peak power usage during working hours is the biggest problem for electricity capacity, and this is the commercial market.

    I do agree the home consumer have the passion for the subject more than commercial business, but as utilities run out of capacity commercial properties have a larger impact with fewer buildings. I have had many conversations with people who are after the home market and I tell them all go for commercial not home. The market is crowded as seen in this post listing 5 startups.

    5 Energy Monitoring Startups to Help You Cut Home Power

    Written by Katie Fehrenbacher

    Posted May 19th, 2008 at 12:00 am in Startups

    The 81 million buildings in the U.S. consume more energy than any other sector of the U.S. economy, including transportation and industry, says the U.S. government. Here’s five startups that are building software and hardware to help consumers and businesses cut down on power consumption. The more building owners know about the power they use, the easier it is to cut energy and carbon-emissions — a case of knowledge equals less power (used).

    Another home monitoring solution is Tendrill http://www.tendrilinc.com/

    I looked at this market and still have an interest, but decided to put my own focus on the data center market as being the early adopter of effective power management best practices.

    I will have a post next week about one of the data center energy monitoring solutions.

    Read more

    More News on Microsoft’s Container Data Center, But What is Inside?

    News.com has an article on Microsoft’s Container Data Centers.

    Microsoft's data centers growing by the truckload

    Posted by Ina Fried

    Once upon a time, Microsoft used to fill its data centers one server at a time. Then it bought them by the rack. Now it's preparing to load up servers by the shipping container.

    Starting with a Chicago-area facility due to open later this year, Microsoft will use an approach in which servers arrive at the data center in a sealed container, already networked together and ready to go. The container itself is then hooked up to power, networking and air conditioning.

    "The trucks back'em in, rack'em and stack'em," Chief Software Architect Ray Ozzie told CNET News. And the containers remain sealed, Ozzie said. Once a certain number of servers in the container have failed, it will be pulled out and sent back to the manufacturer and a new container loaded in.

    It's just one way that Microsoft is trying to cope in a world where it adds roughly 10,000 servers a month.

    As much talk as there is about the containers,  a part we do not know is what is in the containers.  Here are hints Microsoft is pushing for higher efficiency server hardware.

    Gone are the days in which Microsoft settled for off-the-shelf hardware to fill its server farms. These days, Microsoft is looking for servers designed to its exact needs. It's not just that Microsoft doesn't want servers that have keyboard or USB ports--it wants motherboards that don't even have the added wiring necessary to support those things that it will never use. Such moves eliminate cost, space and power consumption.

    "We are not physically building our servers, but there is very deep engagement (with the computer makers)," Josefsberg said.

    Even a 1 percent or 2 percent reduction in power consumption makes a big difference, Josefsberg said. As it is, Microsoft is trying to cram a whole lot of gear in a small space. While server racks at a Web hosting facility might have power densities of 70 watts to 100 Watts per square foot, things are packed far more tightly in the containers, which might be consuming in the thousands of watts of power per square foot.

    Watch for the Server OEMs making noise about new server skus. I wrote about how Microsoft is influencing the industry with its purchasing power.

    Given the purchasing by Microsoft's data center properties (search, hotmail, maps,etc.) are now driving Server OEMs with custom RFPs like the CBlox RFP, OEMs are building exactly what Microsoft wants to run a more efficient data center. And, versus Google's model of requiring exclusive designs no one else in the industry can purchase, the Microsoft skus spill into the rest of the market.

    People can argue the benefits of containers, but listening to Mike Manos and Christian Belady, part of what the containers give Microsoft is a method to determine the compute per watt efficiency for what is in the container.

    Read more

    IBM's Green Sigma

    IBM put together the idea of Green and Six Sigma as news.com reports.

    IBM launches 'Green Sigma' business consulting

    Big Blue has devised a consulting service to profit from corporate initiatives to "go green."

    IBM on Monday detailed its "Green Sigma" consulting practice for reducing energy and water usage at businesses by using networked sensors and data analysis software.

    A shot of IBM's carbon dashboard for tracking energy usage at businesses.

    (Credit: IBM)

    It's based on the Lean Six Sigma management strategy that was originally designed to focus on operational efficiency and customer requirements.

    The idea with Green Sigma is to do an accounting of a company's water and energy usage, both at its own facilities and also its supply chain partners. IBM is piloting the method at two of its own facilities and at two of its customers'.

    This is an idea I've actually used to explain how going green is a commitment like six sigma.   Also it is good to see IBM is including water in its resource management.

    Read more

    Uptime Warns Data Center Pros on Using PUE, a Simple fix

    Matt Stansberry writes on Uptime’s seminar giving warning on the use of PUE.

    Uptime warns data center pros against being benchmarked on PUE


    Posted by: Matt Stansberry
    Data Center Metrics, DataCenter, Green data center

    Uptime Institute executive director Ken Brill warned panelists at an online seminar today to be wary of very low Power Usage Effectiveness (PUE) ratios touted by some data center operators. “If your management begins to benchmark you against someone else’s data center PUE, you need to be sure what you’re benchmarking against,” Brill said.

    Brill said he’s seen companies talking about a PUE of 0.8 — which is physically impossible. “There is a lot of competitive manipulation and gaming going on,” Brill said. “Our network members are tired of being called in by management to explain why someone has a better PUE than they do.”

    If you’re going to compare your PUE against another company, you need to know what the measurement means. “You need to know what they’re saying and what they’re not saying,” Brill said. “Are you going to include the lights and humidification system? If you’re using free cooling six months of the year, do you report your best PUE?”

    Matt was nice enough to send me this link and ask what I thought.

    Here is a simple fix to the problem. PUE should be reported as a range of #’s low to high, and the average calculated over a period of time. This could be a graph.  For example, Microsoft shows their PUE for one facility with this graph.

    image

    This graph shows 3 years of history and how the #’s have fluctuated. This graph is credible. A static PUE # has little meaning as it is just one data point with no background.

    I’ve written about this issue before that PUE is dynamic.

    I've been meaning to write about PUE, and have been stumped in that It is defined as a metric, and in the Green Grid document referenced it makes no reference that is dynamic. In reality PUE will be a dynamic # that changes as the load changes in a room. How ironic would it be that your best PUE # is when all the servers are running at near capacity, and shutting down servers to save power will increase your PUE? Or your energy efficient cooling system uses large amounts of water in Southern California where it is just a matter of time before water shortages will cause more environmental issues?

    What helped me to think of PUE as a dynamic # is to think of it as quality control metric. The quality of the electrical and mechanical systems and their operations over time are inputs into PUE.  As load changes and servers will be turned off the variability of the power and cooling systems influence you PUE.  So, PUE can now have a statistical range of operation given the conditions.  This sounds familiar.  It's statistical process control.

    Statistical Process Control (SPC) is an effective method of monitoring a process through the use of control charts. Much of its power lies in the ability to monitor both process centre and its variation about that centre. By collecting data from samples at various points within the process, variations in the process that may affect the quality of the end product or service can be detected and corrected, thus reducing waste and as well as the likelihood that problems will be passed on to the customer. With its emphasis on early detection and prevention of problems, SPC has a distinct advantage over quality methods, such as inspection, that apply resources to detecting and correcting problems in the end product or service.

    At Data Center Dynamics Seattle, Microsoft’s Mike Manos said the average PUE for Microsoft data centers is 1.6, and his team is driving for 1.3 in 2 years.  When Mike hits a PUE of  1.3 I am sure he’ll show us a graph to prove Microsoft has hit it.

    Read more