Green Workflows

Workflows create an opportunity for efficiency and minimizing waste. Unfortunately, many workflows are difficult to change and bureaucratic requiring users to go through convoluted steps to get their work done. The cause of this many times are IT systems that are inflexible and do not adapt to changes.

The Seattle Times has an article about a workflow software company which puts workflow development in the hands of the users.

Straw that stirs the drink: Even with improved server software, all would be for naught without robust applications. Nintex makes it easy on a small company, allowing it to develop custom applications without an IT department to create complex workflow procedures. "People who own the process can tailor it to their needs, and can manage their own technological portfolio," Campbell said.

One side would argue users know little about developing workflow software, and putting this capability in the hands of users will not work. But, this is also a closed loop system where the people who define the workflows use them, and they can change them.  So, even if they fail at first, they can fix the issues.

This creates an organic learning environment which will allow the system to adapt to the environment.

The co-founder of http://www.nintex.com/  Brett Campbell even makes a point about being an agile company.

Harboring innovation: During Nintex's collaboration with Microsoft, Campbell said he has seen the software giant go from turning like a speedboat into something closer to an aircraft carrier. "But they still need agile partners," he said, "and that's where we come in."

This is one area I have been meaning to research.

Read more

How Important is Green for Digital Realty Trust's New CTO Jim Smith? Green used 7 times in Press Release

Digital Realty Trust has a press release announcing Jim Smith's promotion to CTO. If you don't think Green is important for data centers, the press release has the word "green" seven times. 

Digital Realty Trust Promotes Jim Smith to Chief Technology Officer

In CTO Role, Smith Will Lead Digital Realty Trust's Use of Datacenter Infrastructure Technology

SAN FRANCISCO, Aug 18, 2008 /PRNewswire-FirstCall via COMTEX News Network/ -- Digital Realty Trust, Inc. (NYSE: DLR), the leading owner and manager of corporate and Internet gateway datacenters, has promoted Jim Smith to the role of Chief Technology Officer (CTO). Mr. Smith has served as the Company's Vice President of Engineering. As the first person to hold the title of CTO at Digital Realty Trust, he will take the lead role in directing Digital Realty Trust's implementation of datacenter technologies.

"Jim's work has had a profound impact on the way we design and operate all of our facilities, and this promotion to CTO will allow him to play an even greater role in how we utilize technology to drive increasing value for our customers by reducing costs, increasing operating efficiencies, and developing Green operating environments," said Michael F. Foust, CEO of Digital Realty Trust. "He was recently recognized as one of the top technologists in the industry by InfoWorld, and we are proud to call him our own. Digital Realty Trust is changing the face of the datacenter industry, and he is a big part of our success story."

I've watched Jim Smith present multiple times and he has one of the better green data center presentations. When following up with phone calls, he has demonstrated a good understanding of how his facilities are committed towards being green.

Congratulations Jim.

Read more

Where’s the Wind Power going by 2020 in the US

Here is a post on where Wind Power estimated to be 150 gigawatt by 2020 going to be.

U.S. Wind Poised to Hit 150GW by 2020

Written by Craig Rubens

5 Comments

Posted August 15th, 2008 at 12:00 am in Big Green

The booming U.S. wind market is set to cross the 150 gigawatt mark by 2020, according to a report from market research firm Emerging Energy Research (EER). That includes 5.33 GW installed last year, and another 8 GW currently under construction and planned for completion by the end of this year, EER says. But it will take actually double that 2020 projection — a total of 300 gigawatts — if we want to get 20 percent of our electricity from wind like the DOE and T. Boone Pickens think we can.


This graph shows the US power companies.

Read more

Uptime Warns Data Center Pros on Using PUE, a Simple fix

Matt Stansberry writes on Uptime’s seminar giving warning on the use of PUE.

Uptime warns data center pros against being benchmarked on PUE


Posted by: Matt Stansberry
Data Center Metrics, DataCenter, Green data center

Uptime Institute executive director Ken Brill warned panelists at an online seminar today to be wary of very low Power Usage Effectiveness (PUE) ratios touted by some data center operators. “If your management begins to benchmark you against someone else’s data center PUE, you need to be sure what you’re benchmarking against,” Brill said.

Brill said he’s seen companies talking about a PUE of 0.8 — which is physically impossible. “There is a lot of competitive manipulation and gaming going on,” Brill said. “Our network members are tired of being called in by management to explain why someone has a better PUE than they do.”

If you’re going to compare your PUE against another company, you need to know what the measurement means. “You need to know what they’re saying and what they’re not saying,” Brill said. “Are you going to include the lights and humidification system? If you’re using free cooling six months of the year, do you report your best PUE?”

Matt was nice enough to send me this link and ask what I thought.

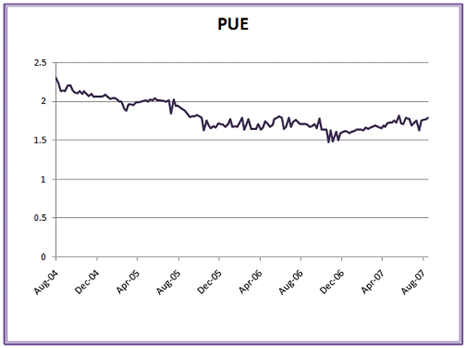
Here is a simple fix to the problem. PUE should be reported as a range of #’s low to high, and the average calculated over a period of time. This could be a graph.  For example, Microsoft shows their PUE for one facility with this graph.
image

This graph shows 3 years of history and how the #’s have fluctuated. This graph is credible. A static PUE # has little meaning as it is just one data point with no background.

I’ve written about this issue before that PUE is dynamic.

I've been meaning to write about PUE, and have been stumped in that It is defined as a metric, and in the Green Grid document referenced it makes no reference that is dynamic. In reality PUE will be a dynamic # that changes as the load changes in a room. How ironic would it be that your best PUE # is when all the servers are running at near capacity, and shutting down servers to save power will increase your PUE? Or your energy efficient cooling system uses large amounts of water in Southern California where it is just a matter of time before water shortages will cause more environmental issues?

What helped me to think of PUE as a dynamic # is to think of it as quality control metric. The quality of the electrical and mechanical systems and their operations over time are inputs into PUE.  As load changes and servers will be turned off the variability of the power and cooling systems influence you PUE.  So, PUE can now have a statistical range of operation given the conditions.  This sounds familiar.  It's statistical process control.

Statistical Process Control (SPC) is an effective method of monitoring a process through the use of control charts. Much of its power lies in the ability to monitor both process centre and its variation about that centre. By collecting data from samples at various points within the process, variations in the process that may affect the quality of the end product or service can be detected and corrected, thus reducing waste and as well as the likelihood that problems will be passed on to the customer. With its emphasis on early detection and prevention of problems, SPC has a distinct advantage over quality methods, such as inspection, that apply resources to detecting and correcting problems in the end product or service.

At Data Center Dynamics Seattle, Microsoft’s Mike Manos said the average PUE for Microsoft data centers is 1.6, and his team is driving for 1.3 in 2 years.  When Mike hits a PUE of  1.3 I am sure he’ll show us a graph to prove Microsoft has hit it.

Read more

Uptime Warns Data Center Pros on Using PUE, a Simple fix

Matt Stansberry writes on Uptime’s seminar giving warning on the use of PUE.

Uptime warns data center pros against being benchmarked on PUE


Posted by: Matt Stansberry
Data Center Metrics, DataCenter, Green data center

Uptime Institute executive director Ken Brill warned panelists at an online seminar today to be wary of very low Power Usage Effectiveness (PUE) ratios touted by some data center operators. “If your management begins to benchmark you against someone else’s data center PUE, you need to be sure what you’re benchmarking against,” Brill said.

Brill said he’s seen companies talking about a PUE of 0.8 — which is physically impossible. “There is a lot of competitive manipulation and gaming going on,” Brill said. “Our network members are tired of being called in by management to explain why someone has a better PUE than they do.”

If you’re going to compare your PUE against another company, you need to know what the measurement means. “You need to know what they’re saying and what they’re not saying,” Brill said. “Are you going to include the lights and humidification system? If you’re using free cooling six months of the year, do you report your best PUE?”

Matt was nice enough to send me this link and ask what I thought.

Here is a simple fix to the problem. PUE should be reported as a range of #’s low to high, and the average calculated over a period of time. This could be a graph.  For example, Microsoft shows their PUE with this graph.

image

This graph shows 3 years of history and how the #’s have fluctuated. This graph is credible. A static PUE # has little meaning as it is just one data point with no background.

I’ve written about this issue before that PUE is dynamic.

I've been meaning to write about PUE, and have been stumped in that It is defined as a metric, and in the Green Grid document referenced it makes no reference that is dynamic. In reality PUE will be a dynamic # that changes as the load changes in a room. How ironic would it be that your best PUE # is when all the servers are running at near capacity, and shutting down servers to save power will increase your PUE? Or your energy efficient cooling system uses large amounts of water in Southern California where it is just a matter of time before water shortages will cause more environmental issues?

What helped me to think of PUE as a dynamic # is to think of it as quality control metric. The quality of the electrical and mechanical systems and their operations over time are inputs into PUE.  As load changes and servers will be turned off the variability of the power and cooling systems influence you PUE.  So, PUE can now have a statistical range of operation given the conditions.  This sounds familiar.  It's statistical process control.

Statistical Process Control (SPC) is an effective method of monitoring a process through the use of control charts. Much of its power lies in the ability to monitor both process centre and its variation about that centre. By collecting data from samples at various points within the process, variations in the process that may affect the quality of the end product or service can be detected and corrected, thus reducing waste and as well as the likelihood that problems will be passed on to the customer. With its emphasis on early detection and prevention of problems, SPC has a distinct advantage over quality methods, such as inspection, that apply resources to detecting and correcting problems in the end product or service.

At Data Center Dynamics Seattle, Microsoft’s Mike Manos said the average PUE for Microsoft data centers is 1.6, and his team is driving for 1.3 in 2 years.  When Mike hits a PUE of  1.3 I am sure he’ll show us a graph to prove Microsoft has hit it.

Read more