Jeff Dean publishes Part 1 of Reflection of 2017 Google Brain results - ML, ML, and more ML

Jeff Dean posted part 1 of his reflection of Google Brain’s 2017 achievements. https://research.googleblog.com/2018/01/the-google-brain-team-looking-back-on.html

If you don’t know what Google Brain is you can check out this wiki post.  https://en.m.wikipedia.org/wiki/Google_Brain

When you read the post you can see the work is lots and lots of ML. Using the below infrastructure.  Well they are probably using some really amazing stuff that Google won’t share for a long time. This is the elite Google Brain team they can get anything they want.


IMG_0239.JPG

As an example of some of their work Jeff references this text to speech work. https://google.github.io/tacotron/publications/tacotron2/index.html 

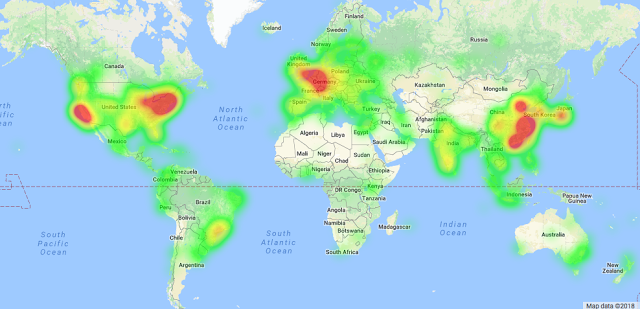
Check out this graphc that shows where TensorFlow is used. 


IMG_0240.PNG

Compass Data Centers 2018 Predictions

Chris Crosby has a post on his 2018 predictions. https://www.compassdatacenters.com/predictions-for-2018/ 

At first I was tempted to go through each one and add my own opinion. But I am writing this blog post sitting in Black Raven Brewery http://blackravenbrewing.com/


FullSizeRender.jpg

So after a beer thinking I should just write what comes to mind after a pint. 

What Chris is missing is the impact of AR. It will be huge and people are excited. What is funny is where I am drinking a pint is within walking distance to Facebook’s Oculus new facility which is a lot of ex-Microsoft people  https://www.geekwire.com/2018/facebook-microsofts-backyard-building-purchases-point-oculus-expansion/

“It is unclear what the sites will be used for, and Facebook and Oculus representatives did not return requests for comment. GeekWire reported recently that Oculus is looking for a couple hundred thousand square feet of research and development space in Redmond as well as a huge chunk of office space in the Seattle area.


Job listings also point to an Oculus expansion in Redmond.Facebook lists 123 open positions in Redmond, and almost all of them are for Oculus. Aposting for an Oculus facilities project managerincludes “work on multiple expansion and renovation projects in its Oculus facilities in Redmond. Projects are all on a fast track schedule to support the planned growth in the area.”

What I agree totally with on Chris’s prediction #6 is DCIM will create a new acronym as it tries to gain traction. There so many flaws in DCIM. And the top is they don’t get abstraction. There way too many failed DCIM implementations out there.

The big are growing so much faster than rest. Amazon is rumored to be testing their advertising efforts. Which is direct blow to google and facebook. 

Actually I agree with all of Chris’s points. 2018 is going to be interesting and confusing because as the last point made #10

10) Data center publications will continue to publish articles speculating on the future demise of enterprise data centers in relation to the cloud when there is nothing else to talk about. 

Interactive Submarine Cables Map by ESRI

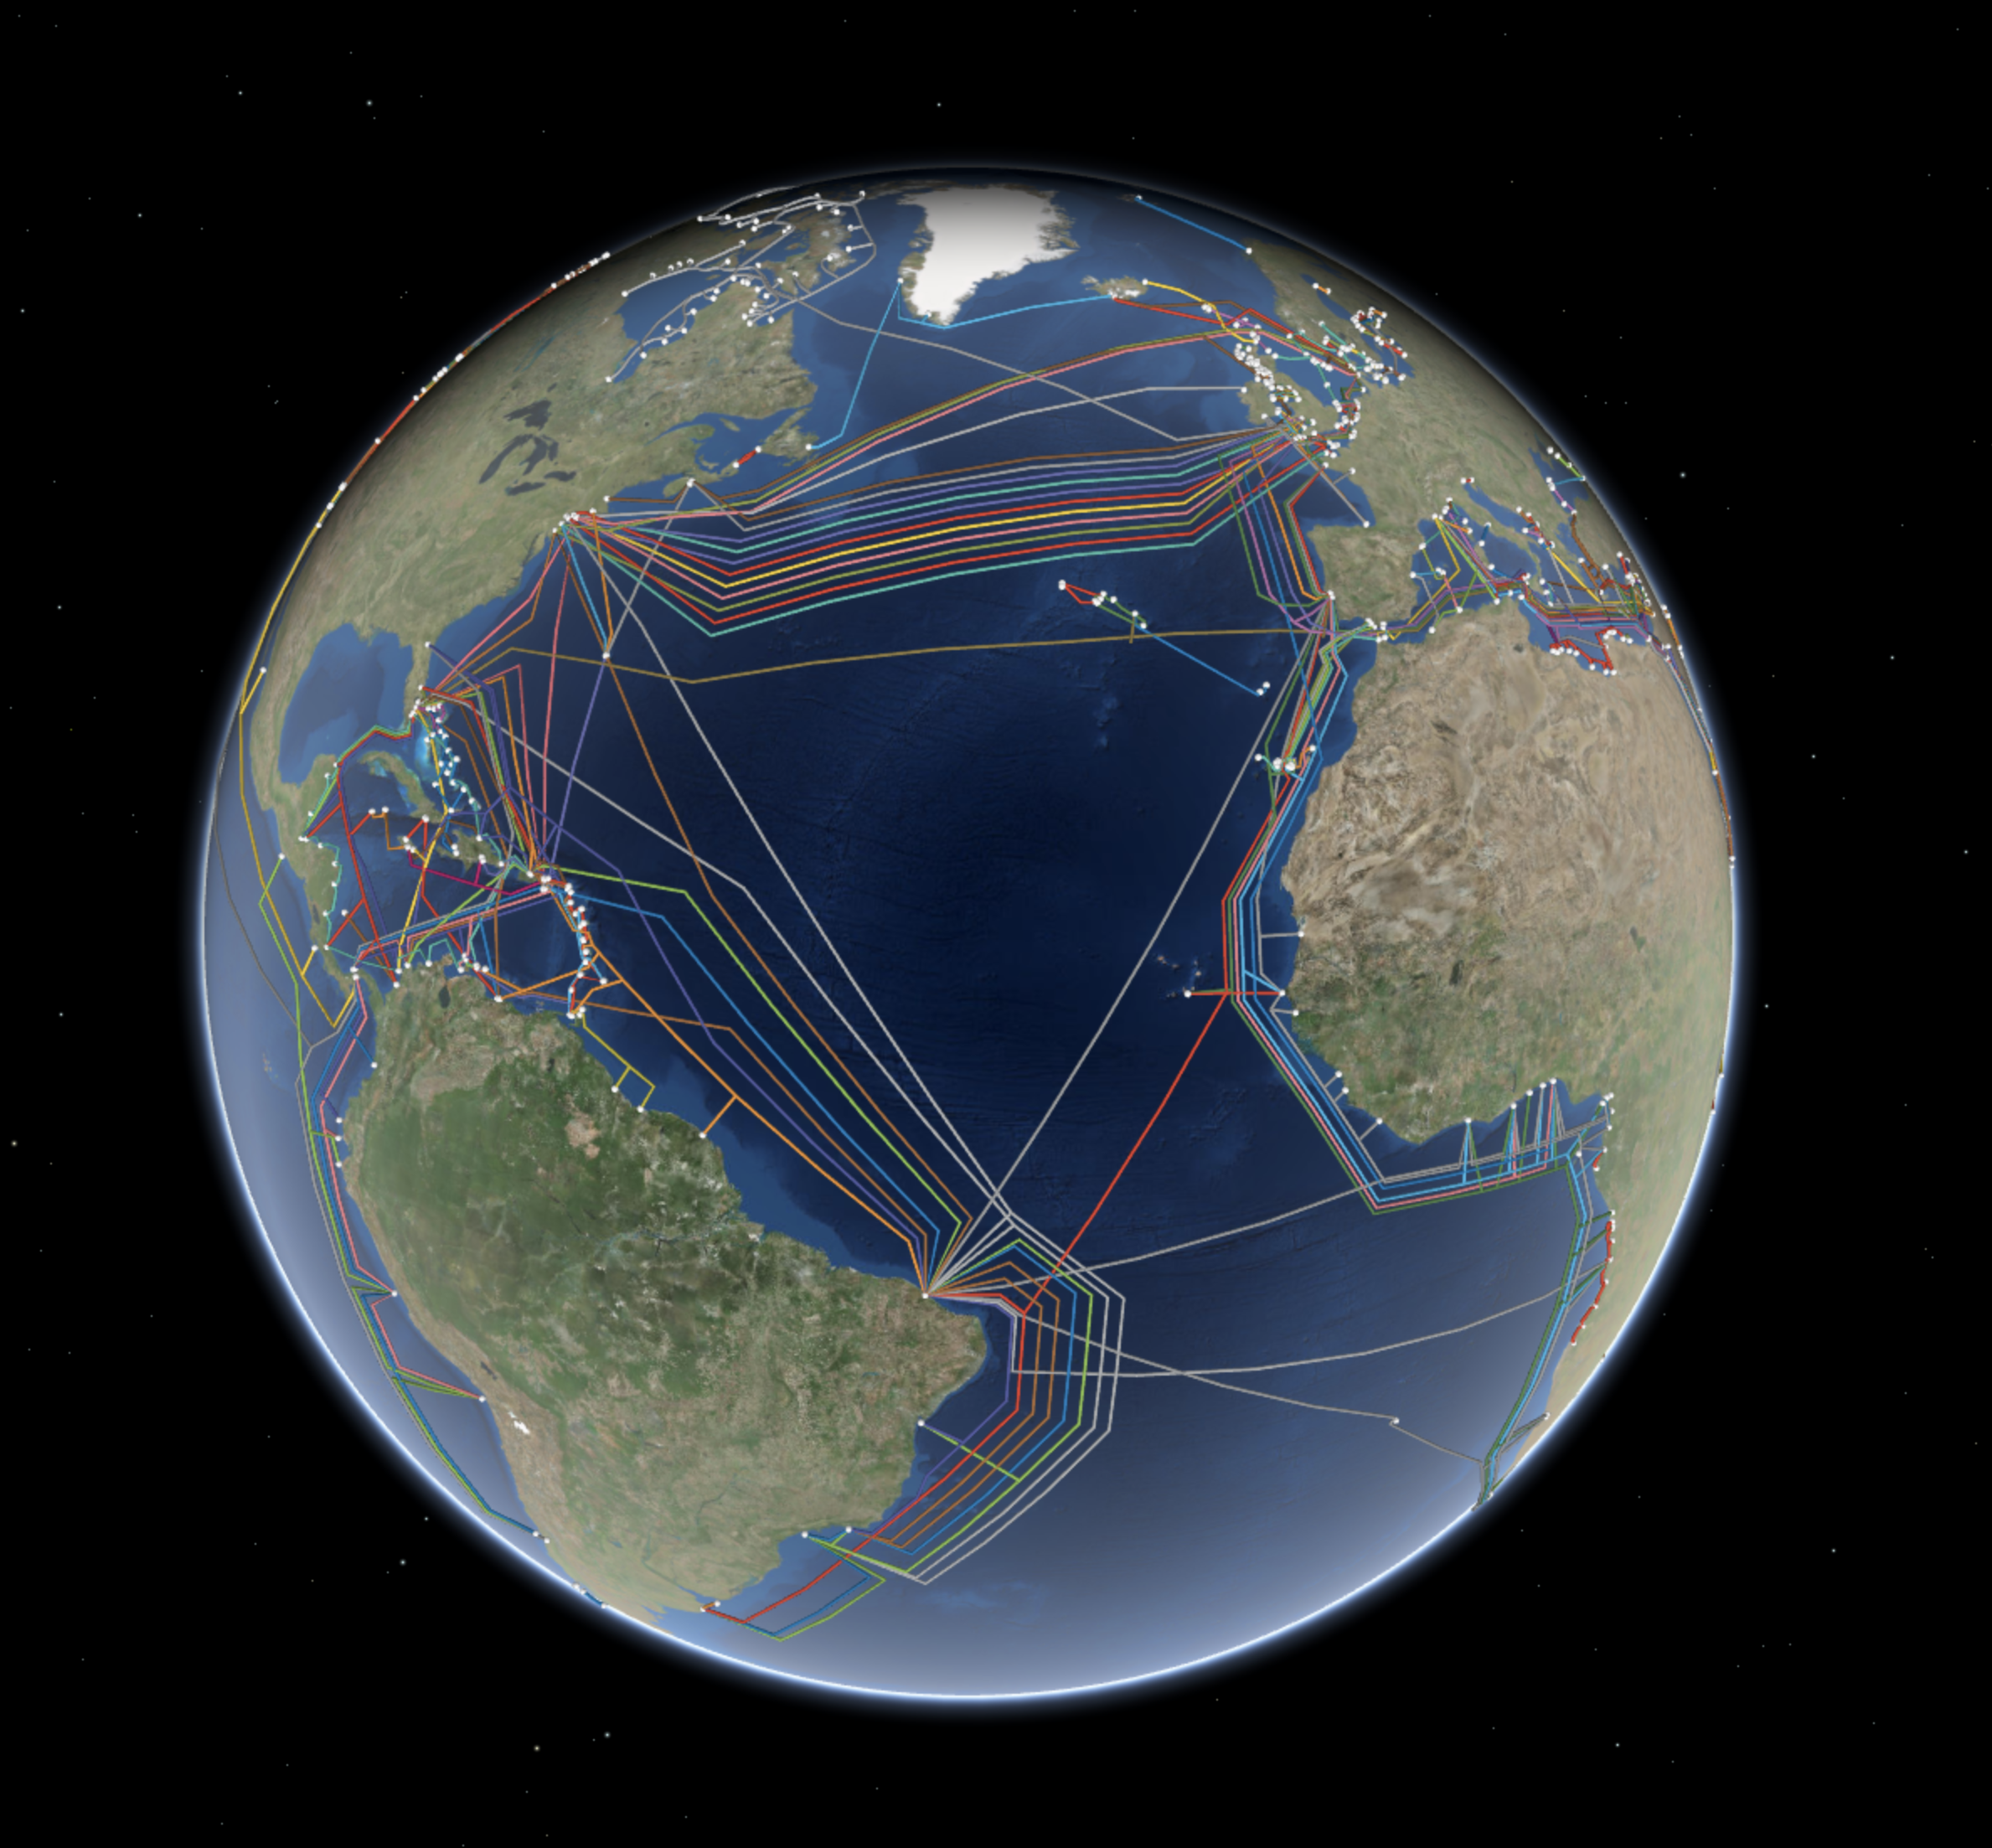
We have all seen submarine cable maps. What is nice is ESRI has one that is a live map. The link is here.

esri.png

You can review the cables based on year, cables, or landing points.

Screen Shot 2018-01-04 at 13.44.18.png
Why We Love It

Deep on the ocean floor you will find communication cables made to carry signals from one land to another. The first undersea communications cables, laid in the 1850s, carried telegraphy. Now these cables carry our phone and Internet traffic. Yet, they remain relatively hidden in the depths of the ocean. We love how this map lets us explore global cable connections. We can see the cables all at once or focus on interdependencies by using the contents pane to filter by construction year, a specific cable, or a landing point.

Why It Works

When we view undersea cable data on a global scene view, we get a real sense of how these cables tie together the world’s populated places. This map uses spheres and tubes to symbolize the landing points and cables. This works to emphasize connectivity while remaining playful and easy to understand. When you filter information based on a single cable, landing point, or construction year, you can see interdependencies that are otherwise less obvious. This map does not rely on traditional pop-ups when you select a feature, but instead hides all unrelated features.