Shh, a secret on why the Green Data Center is popular, it's the money

One of things I figured out long time ago as an Industrial Engineer is efficiency is good to some, but not all.  If you talk about being Green you get almost all the people saying being green is good with few fighting the green initiative.  And what is behind a big of being green?  A big part is being efficient.  

Chris Crosby does a good job of giving an insiders view of the secret of being green in the data center business.

“We all talk about being green like it’s our ticket to corporate sainthood, but really we just keep improving the energy efficiency of our data center operations because it helps us make more money”.

...

You really thought that all this incessant talk about being “green” was about saving the planet? How quaint. Well, why don’t you come sit up front here and let me explain a few things.

Got your attention?  Chris explains more.

Marketing, and its very close friend Public Relations, are all about making people want things because they think they are important. So about five years ago, some very bad people began to say that data centers used too much energy and that wasn’t good for the environment. While a whole bunch of folks in the data center business panicked, some marketing people got together and said, “This is awesome. We know that using too much power hurts our profit margins, and people that think that’s bad anyway, so let’s jump on the bandwagon and call our energy efficiency efforts “green initiatives” and then everyone will be happy”. This is what’s known as a win/win proposition. Naturally, the whole industry cheered.

NewImage

Seizing on this new vision, data center companies began to improve their energy efficiency. They even came up with a new standard to help measure the improvements in performance called PUE so customers could prove it to themselves. This new standard has become so popular that now data center providers and operators use it as part of their marketing and PR efforts. Really big operators love this concept. They do all kinds of wild things like spending large sums of money on horribly inefficient technologies like solar panels so they can turn around and talk about their commitment to being green. Now of course we all know that this is just to keep large groups of generally unshaven, Birkenstock wearing extremists from causing a big fuss and driving down their stock price, so we all play along and show our support by saying things like, “Man, that’s what I call a real commitment to green”. See the double meaning there? A lot of people don’t, but for obvious reasons we don’t bother to correct them.

Metrics drive behaviors some not intended, Example of CA HOV change for Hybrid Cars

PUE metric is simple and effective way for people to understand the power and cooling efficiency of their data center.  The more people discussing PUE, the lower the numbers go, the difference hopefully will decrease.  A strange example of a difference causing an unintended affect is in California's booting the "Prius Perk" from the HOV lanes.

Auto - LEISURE

Loss Of California HOV-Lane 'Prius Perk' Slows All Traffic

By 

Published October 14, 2011

| High Gear Media

Many California drivers silently cheered on July 1, when the yellow stickers on 85,000 hybrid cars expired--meaning their drivers were no longer allowed to travel solo in the carpool lane.

According to a new study released Monday at the University of California-Berkeley, though the loss of the single-occupant privilege that was cheered by other drivers may have made their own lives paradoxically worse.

The study is here.

We verify that slow speeds in a special-use lane, such as a carpool or bus lane, can be due to both high demand  for that lane and slow speeds in the adjacent regular-use lane.  These dual influences are confirmed from months of data collected from all freeway carpool facilities in the San Francisco Bay Area.  Additional data indicate that  both influences hold not only for other types of special-use lanes, including bus lanes, but also for other parts of the world.

The findings do not bode well for a  new  US  regulation stipulating that most classes of LowEmitting Vehicles, or LEVs, are to vacate slow-moving carpool lanes.  These LEVs invariably constitute small percentages of traffic; e.g. they are only about 1% of the freeway traffic demand in the San Francisco Bay Area.  Yet, we show that relegating some or all of these vehicles to regular-use lanes can significantly add to regular-lane congestion, and that this, in turn, can also be damaging to vehicles that continue to use the carpool lanes.  Counterproductive outcomes of this kind are predicted first by applying kinematic wave analysis to a real Bay Area freeway.  The site stands to suffer less from the  regulationthan will others in the region. Yet,  we predict that the site’s people-hours and vehicle-hours traveled during the rush will each increase by  more than 10%, and that carpool-lane traffic will share  in  the damages.  Real data from the site support these predictions.  Further parametric analysis of a hypothetical, but more generic freeway system indicates that  these kinds of  negative outcomes will be widespread.  Constructive ways to amend the new regulation are discussed, as are promising strategies to increase the vehicle speeds in carpool lanes by improving the travel conditions in regular lanes.

Google Uncloaks its Carbon Impact and Energy Use of company including Data Centers

3 Years ago I had the pleasure of talking to Google’s Urs Hoelzle regarding Google’s PUE.

And now Urs makes a bigger announcement today.

How our cloud does more with less


Posted by Urs Hoelzle, Senior Vice President, Technical Infrastructure
We’ve worked hard to reduce the amount of energy our services use.  In fact, to provide you with Google products for a month — not just search, but Google+, Gmail, YouTube and everything else we have to offer — our servers use less energy per user than a light left on for three hours. And, because we’ve been a carbon-neutral company since 2007, even that small amount of energy is offset completely, so the carbon footprint of your life on Google is zero.

We’ve learned a lot in the process of reducing our environmental impact, so we’ve added a new section called “The Big Picture” [link to come] to our Google Green site with numbers on our annual energy use and carbon footprint.

Google’s greener data centers get #1 position.

We started the process of getting to zero by making sure our operations use as little energy as possible.  For the last decade, energy use has been an obsession. We’ve designed and built some of the most efficient servers and data centers in the world—using half the electricity of a typical data center. Our newest facility in Hamina, Finland, opening this weekend, uses a unique seawater cooling system that requires very little electricity.

image

Renewable Energy gets position #2.

Whenever possible, we use renewable energy. We have a large solar panel installation at our Mountain View campus, and we’ve purchased the output of two wind farms to power our data centers.  For the greenhouse gas emissions we can’t eliminate, we purchase high-quality carbon offsets.

image

The company and carbon impact are #3 and #4.

image

Jonathan Koomey's v2.0 of Data Center Energy use shows slower growth than expected


The NYTimes has an article about Jonathan Koomey's research.

Data Centers’ Power Use Less Than Was Expected

By JOHN MARKOFF
Published: July 31, 2011

SAN FRANCISCO — Data centers’ unquenchable thirst for electricity has been slaked by the global recession and by a combination of new power-saving technologies, according to an independent report on data center power use from 2005 to 2010.

Here is Jonathan's blog post.

My new study of data center electricity use in 2010

I just released my new study on data center electricity use in 2010.  I did the research as an exclusive for the New York Times, and John Markoff at the Times wrote an article on it that will appear in the print paper August 1, 2011.  You can download the new report here.

Stock1

I research, consult, and lecture about climate solutions, critical thinking skills, and the environmental effects of information technology.

What are the three reasons Jonathan references as the reason for slower energy use vs. the 2007 study he researched?

  1. 2008-9 economic crisis
  2. the increased prevalence of virtualization in data centers
  3. the industry’s efforts to improve efficiency of these facilities since 2005

My assumption is Jonathan as a numbers guy would put these in order of significance. So, if the economy did not hit the rough spot in 2008 - 9, then the energy growth would  be much bigger.  The economy was a bigger factor than virtualization, aka the cloud.  And virtualization cut more energy than PUE improvements.  Although as the NYTimes says it is difficult to break down the numbers, sometimes you need to trust your gut on what feels right and I agree with these assumptions.

Though Mr. Koomey was unable to separate the impact of the recession from that of energy-saving technologies, the decline in use is surprising because data centers, buildings that house racks and racks of computers, have become so central to modern life. They are used to process e-mail, conduct Web searches and handle online shopping as well as banking transactions and corporate sales reports.

But, let's look at who did double, triple, quadruple their data centers from 2005 - 2010.

Google almost tripled the number of servers from 2005 - 2010 going from 350k to 900k of servers with an energy use of 0.7 BkWh to 1.9 BkWh.

image

Facebook launched in Feb 2004 and now has 100,000+ Servers.  In 2005 Facebook may have 100 servers, so 1,000 fold increase.

Zynga started in Jan 2007 probably has 50,000+ servers if you count the ones in AWS.  Infinite vs 2005

Amazon Web Services launched July 2006 has probably close to 100,000 servers.  Infinite vs. 2005.

Jonathan worked on the EPA study for 2007, and he released v2.0 update Aug 2011.  I think someone needs to fund his research so he published at least every other year. Infinite vs. 2005.

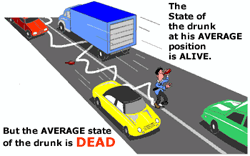
So, even though the average only moved 56%.  What is much more interesting to me is the guys who were far above the average.  Too many times people focus on the average as they can't think about the range of the numbers.  Dr. Sam Savage has called this the Flaw of Averages.

The error of a single number view vs. the range can be illustrated by the "Flaw of Averages."

The Flaw of Averages
A common cause of bad planning is an error Dr. Savage calls the Flaw of Averages which may be stated as follows: plans based on average assumptions are wrong on average.

As a sobering example, consider the state of a drunk, wandering around on a busy highway. His average position is the centerline, so...

Thinking air-side economizer use, consider Seattle has had only 351 minutes of over 80 degrees this summer

I know this will not make you locate your data center in Seattle, but this is a fun piece of weather trivia.  As of July 24 there have been only 351 minutes of over 80 degree weather this summer.

Seattle soaks up some summer -- 273 minutes of it to be exact

By Scott Sistek

Story Created: Jul 24, 2011 at 9:39 PM PDT

For a while, it seemed Seattle was about to cement its legacy as home of the 78-minute summer.

But no more.

With a nice warm, sunny Sunday, Seattle now has had its first extended "summer experience" which I had defined as 80 degrees or warmer at the University of Washington.

The total tally was 273 minutes Sunday (4 hours, 33 minutes) bringing our entire Seattle summer experience up to a whopping 351 minutes.

I have joked that if Global Warming happens we are going to see a migration to the Pacific Northwest.

And Texas is on the end of the spectrum.

Meanwhile, in Waco, the streak continues for now. Thursday's high of 103 degrees marks the 29th straight triple-digit day and the 46th such day of 2011.